

The following table is the same as the one given in the paper. Other tables in this document have a similar structure,
Generally, we ran a test as long as its behaviour remains unobserved. This, and the differences as regards speed and core numbers of the tested machines, explains why number of runs vary from test to test.
Overall, for an unobserved behaviour, the number of runs is at least 91M (91 · 106) for PowerG5, 1.2G (1.2 · 109) for Power6 and 2.6G (2.6 · 109) for Power7, and often more.
| Kind | Model | PowerG5 | Power6 | Power7 | |
| MP+lwsync+porr | Forbid | = | Ok, 0/302M | Ok, 0/3.4G | Ok, 0/6.1G |
| MP+poaa+addr | Allow | = | No, 0/302M | Ok, 27k/1.1G | Ok, 56/1.4G |
| Allow unseen | |||||
| MP+eieioaa+addr | Forbid | = | Ok, 0/900M | Ok, 0/2.9G | Ok, 0/16G |
| 2+2W+rfipr-datarps | Allow | = | No, 0/284M | Ok, 58/545k | No, 0/4.4G |
| Allow unseen | Allow unseen |
The “RSV” tests are basic checks of lwarx/stwcx. semantics.
| Kind | Model | PowerG5 | Power6 | Power7 | |
| RSV+FAIL+SIMPLE | Allow | Forbid | Ok, 3/35k | Ok, 1/38k | Ok, 4/36k |
| RSV+FAIL | Allow | Forbid | Ok, 1/204M | Ok, 2/3.0G | Ok, 1/5.8G |
| RSV+SPEC0 | Allow | Forbid | Ok, 4/408M | Ok, 7/5.9G | Ok, 8/12G |
| RSV+SUCCESS | Allow | = | Ok, 2.0M/4.0M | Ok, 324k/651k | Ok, 307k/641k |
| RSV+SPEC | Forbid | = | Ok, 0/240M | Ok, 0/3.7G | Ok, 0/5.8G |
The first three tests, RSV+FAIL+SIMPLE, RSV+FAIL and RSV+SPC0 are of interest, as they illustrate the reservation granule issue — see p. 663 in Power ISA. Namely, reservations are held on aligned memory chunks whose size is unspecified by the architecture.
Consider for instance the simplest test, RSV+FAIL+SIMPLE: the test performs a load reserve (lwarx) from some location y and then attempt a store conditional (stwcx.) to a different location x. The execution of interest of this test is when the store conditional succeeds:
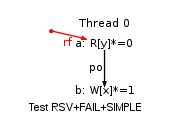
In our model the size of the reservation granule is word size. As a result, our model forbids the execution above (i.e. the store conditional never succeeds). However, we tested machines whose reservation granule is larger that a word (typically a cache line size, i.e. 128 bytes). As a result we observe the execution above, when the addresses of locations x and y are close enough one to the other, so that they are in the same reservation granule.
The remaining “PPO” tests are
variations of PPOCA (and of PPOAA).
Test PPOCA is MP with a complex second thread:
(a):Ry0 -control-> (b):Wx1 -> (c):Rx1 -addr-> (d):Rz0
Among those, test PPO+CXA replaces the load (c) by a lwarx, while tests PPO+CA+A and PPO+CA+B replace the store (b) by a stwcx., with the companion lwarx being far apart or just before. All these PPO… variations are forbidden by the model and unobserved.
| Kind | Model | PowerG5 | Power6 | Power7 | |
| PPO+RMW | Forbid | = | Ok, 0/204M | Ok, 0/3.3G | Ok, 0/4.8G |
| PPOCA | Allow | = | Ok, 1.1k/3.4G | No, 0/43G | Ok, 175k/157G |
| Allow unseen | |||||
| PPOCXA | Forbid | = | Ok, 0/240M | Ok, 0/3.7G | Ok, 0/7.4G |
| PPOCA+A | Forbid | = | Ok, 0/244M | Ok, 0/3.8G | Ok, 0/5.8G |
| PPOCA+B | Forbid | = | Ok, 0/240M | Ok, 0/3.8G | Ok, 0/5.8G |
| PPOAXXA | Forbid | = | Ok, 0/240M | Ok, 0/3.8G | Ok, 0/7.4G |
| PPOCXXA | Forbid | = | Ok, 0/240M | Ok, 0/3.8G | Ok, 0/7.4G |
Taking all tests together is 13963 tests. Our model exploration tool terminated in less then 16GB memory for 11029 tests1. We checked that simulator output, when available, is not contradicted by hardware.
Namely, our simulator execute OCaml code derived from lem formal specifications. As a result, the simulator can be trusted to follow model specifications. However, our executable code is not optimised for speed and the simulators do not always terminate in decent time or memory space on input that features three processors or more, complex code sequences, or numerous memory accesses.
We thus resort to distributed execution of the simulators on two clusters of AMD opteron and Intel Xeon processors. Overall we have more than 650 cores available, which we share with other users. Our experiments lasted weeks and consist in repetitively running the simulator on the complete test base under increasing processor time and memory usage limits.
The following table accounts for our simulator experiments:
| N | avg (sec.) | geom (sec.) | max (sec.) | effort (sec.) | memory (Gb) | |||||
| 11029/13963 | 3785.75 | 103.90 | 1.2e+05 | 2.9e+08 | 16.0 | |||||
The “N” column shows how many tests finally completed successfully in the allocated processor time and memory limits. We also give a few statistics: the “avg” (resp. “geom”) column shows the arithmetic (resp. geometric) mean of successful runs; while the “max” column show the time of the test that takes longer to complete successfully (here 33.3 hours). This test is Z6.1+rfipr-datarp+lwsync+data:
| Kind | Model | PowerG5 | Power6 | Power7 | |
| Z6.1+rfipr-datarp+lwsync+data | Allow | = | No, 0/140M | Ok, 3/30M | No, 0/2.8G |
| Allow unseen | Allow unseen |
The “effort” column shows the total CPU time allocated to simulator runs (including failed runs due to intentional resource limits): the total computing effort amounts to about 3317 days of machine time. Finally, the “memory” column shows the maximum memory limit we used.